nf-prometheus
nf-prometheus is an open-source Nextflow plugin that exports workflow and task metrics in the Prometheus exposition format — designed for on-premise HPC clusters, where the head job often runs on a compute node behind a firewall that your Prometheus server cannot reach.
Three export modes
| Mode | Best for |
|---|---|
| Textfile collector | Air-gapped and firewalled clusters: writes a .prom file (atomic rename) for the node_exporter textfile collector on a shared filesystem. Zero network requirements. |
| Pushgateway | Live monitoring during the run: pushes to your Prometheus Pushgateway, one metric group per run, batch-job lifecycle handled by the gateway. |
HTTP /metrics | Classic scrape, when the head job's node is reachable from your Prometheus server. |
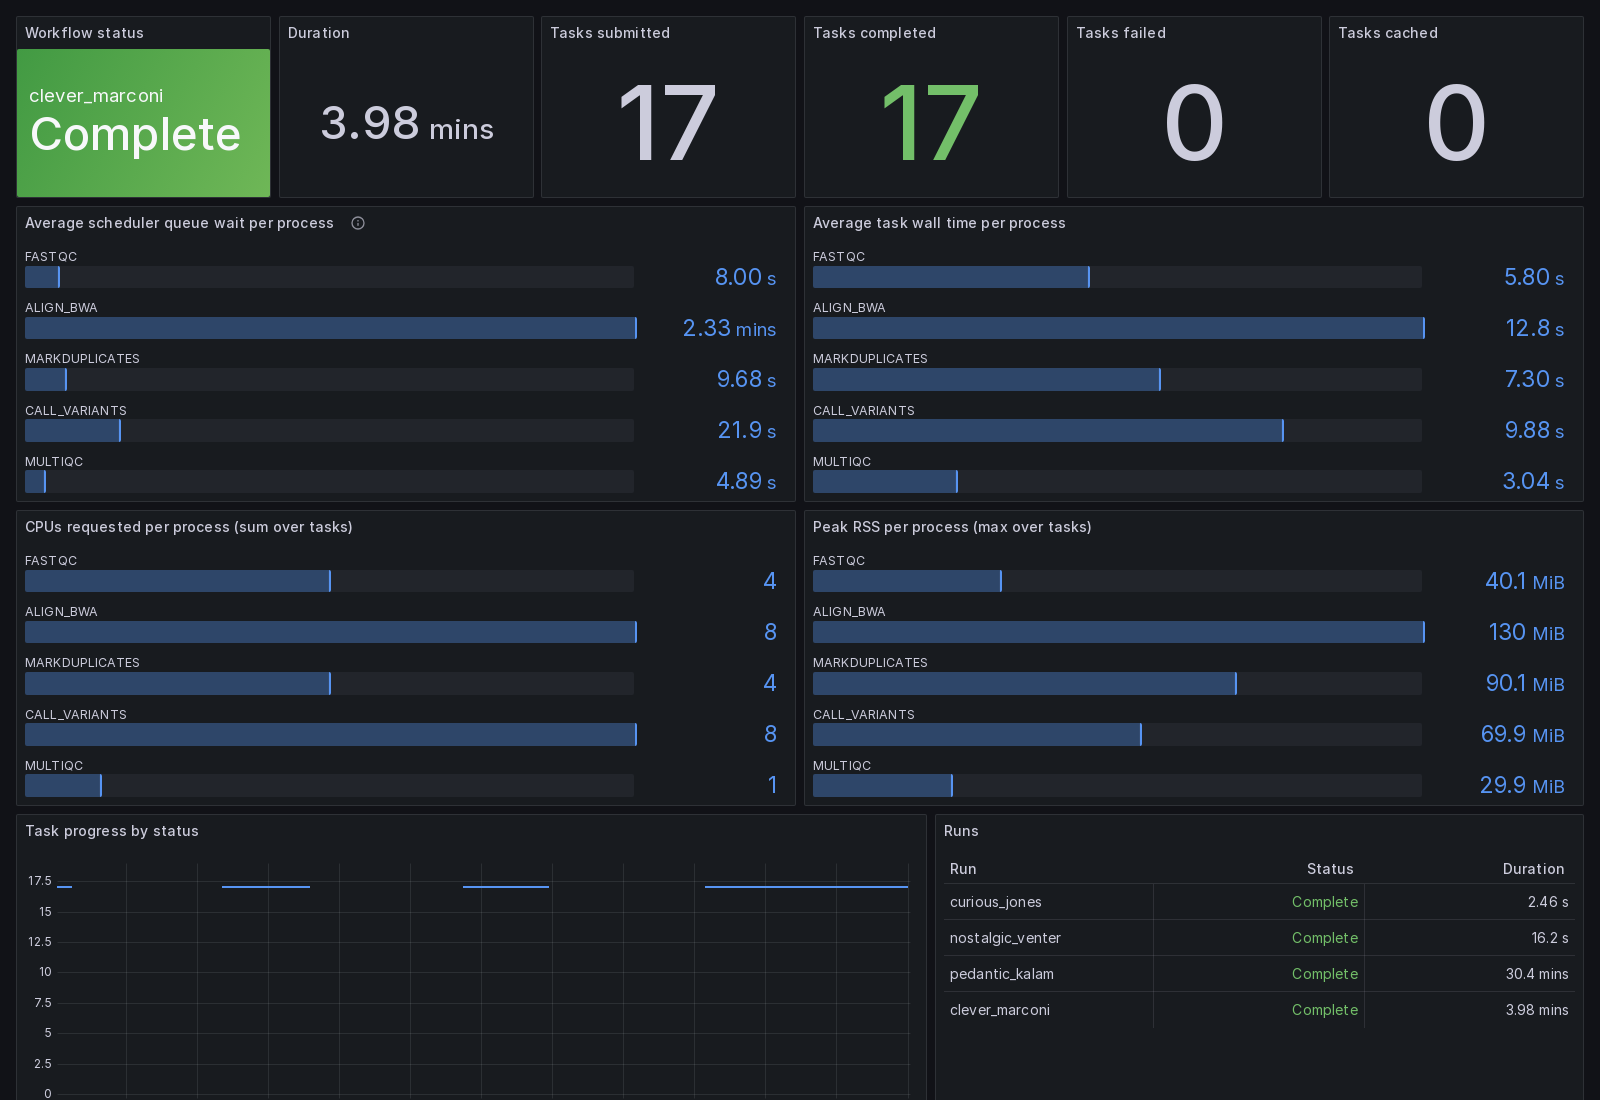
What you see
- Per-process scheduler queue wait — the number your login-node
squeuenever aggregates for you - Requested vs. used resources (CPUs, peak RSS) per process
- Run status, duration, task counts by state (submitted / completed / failed / cached)
- A ready-to-import Grafana dashboard ships with the plugin
Quickstart
// nextflow.config
plugins {
    id 'nf-prometheus'
}

prometheus {
    path = '/shared/metrics/my-pipeline.prom'   // textfile mode
    // pushgateway = 'http://pushgateway:9091'  // live mode
    // httpPort = 9200                          // scrape mode
}
Zero dependencies beyond the JDK, Apache 2.0 licensed, minimum Nextflow 25.10, built on the v2 observer API.
Source and documentation: github.com/mcallisto/nf-prometheus