Where did my task go? Monitoring Nextflow on Slurm without Tower
If you run Nextflow pipelines on a university HPC cluster, your monitoring
stack probably looks like mine did: one terminal tailing .nextflow.log,
another running squeue every thirty seconds, and a growing suspicion that
somewhere between "submitted" and "completed" your tasks are spending a lot
of time doing nothing at all.
The frustrating part is that the information exists. Nextflow knows when it
submitted each task and when Slurm actually started it. It knows how much
memory you requested and how much the process actually used. It just doesn't
show you any of this while the run is going — and by the time you're staring
at the trace file after a failed 14-hour run, aggregating submit-to-start
deltas per process with awk is nobody's idea of observability.
The options, as of 2026
The obvious answer is Seqera Platform (formerly Tower), and if your lab runs in the cloud with a budget, it's a good one. On a shared on-premise cluster the picture is different:
- Seqera Cloud's free tier is sized for trying things out — a handful of users and concurrent runs, limited run history. Fine for one person; not for a core facility with dozens of users.
- Self-hosting Seqera Platform is an Enterprise license conversation.
- The open-source nf-tower was archived in January 2025 and is unmaintained.
-with-webloggives you a firehose of JSON events and a "build the rest yourself" exercise.
Meanwhile, every HPC cluster I've touched already runs a Prometheus and Grafana stack somewhere — the sysadmins use it for node health. What's missing is the bridge between Nextflow's head job and that stack.
The awkward thing about head jobs
Here's what makes the bridge less trivial than "expose an HTTP endpoint": on a well-run cluster your Nextflow head job isn't on the login node — it's a batch job itself, running on a compute node behind a firewall, with an IP your Prometheus server has never heard of and no inbound connectivity at all. Classic pull-based scraping simply doesn't reach it. On air-gapped clusters, nothing does.
But there is one thing every HPC node can always do: write a file to the
shared filesystem. And it turns out Prometheus grew an idiom for exactly
this situation years ago — the node_exporter textfile collector, built
for batch jobs and cron scripts. Write your metrics to a .prom file
atomically, point a node_exporter at the directory, done. No network, no
credentials, no agent on the cluster.
That observation became nf-prometheus: a small
(zero-dependency, Apache 2.0) Nextflow plugin that listens to workflow
events and exports them in Prometheus format, textfile-first. A Pushgateway
mode covers live updates during the run, and a classic HTTP /metrics
endpoint exists for the cases where the head node is actually reachable.
The metric I built it for is per-process scheduler queue wait — the
submit-to-start time your squeue never aggregates for you. On the
dashboard it sits next to requested-vs-used CPUs and peak RSS, which
together answer the two questions every cluster admin eventually asks a
pipeline user: why are you queued so long and why did you request 32 GB
for a process that peaks at 4.
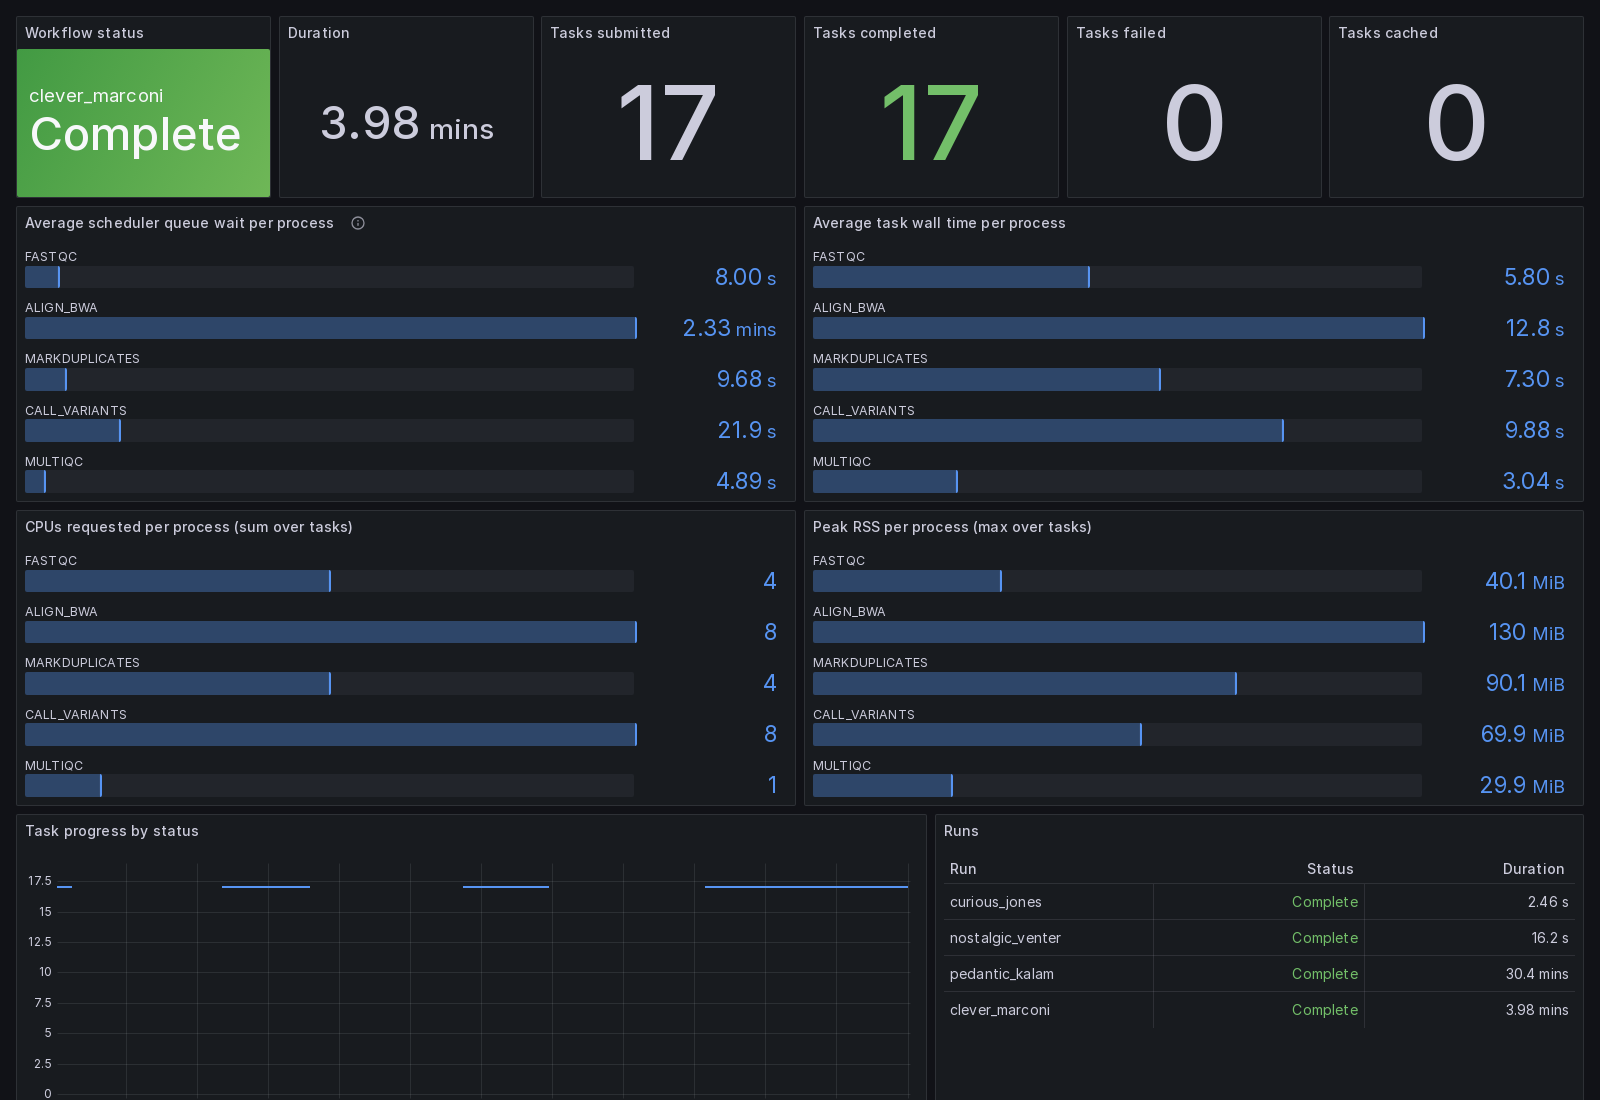
Setup genuinely takes about five minutes: the walkthrough is in the repo.
Three things the test cluster taught me
I developed the plugin against a single-node Slurm cluster in a container
(Rocky 9, Slurm from EPEL — the setup ships in the repo under dev/slurm/).
Even a toy cluster manages to reproduce the greatest hits of real HPC
operations:
1. The node that drains itself. After every container restart, and
occasionally after successfully finishing jobs, slurmctld would put the node
in drain — reason: Kill task failed. With proctrack/pgid (no cgroups
in a container), slurmd is slow to reap task process groups and drains the
node out of caution. Jobs sit in PD forever and nothing in Nextflow's
output tells you why. sinfo first, always. (UnkillableStepTimeout and an
auto-resume watchdog fixed the dev environment.)
2. The metrics that were silently empty. My first dashboard had a
beautiful peak-RSS panel showing nothing. Nextflow only collects per-task
resource metrics if an observer explicitly asks for them by returning
true from enableMetrics() — which the plugin template doesn't mention.
One overridden method later, a task that allocated 60 MB dutifully reported
a 73 MB peak. An empty dashboard panel is an integration test, if you let
it be one.
3. cgroups v2 without systemd. Slurm's cgroup plugin wants to create
its scope via dbus, which doesn't exist in a container. IgnoreSystemd=yes
in cgroup.conf is the documented escape hatch, and one more entry in the
"things that are obvious after you know them" file that HPC runs on.
None of these are exotic. They're Tuesday on a real cluster — which is rather the point of having a dashboard that shows you where the time went instead of a log that shows you everything except that.
What's next
The plugin does one thing right now: run-level observability. The obvious next layer — and the reason the metrics carry the labels they do — is showback: CPU-hours per pipeline, per user, per PI, the number a core facility needs at the end of the quarter. That's where this is headed.
If you run Nextflow on Slurm (or PBS, or LSF) and this scratches an itch — or conspicuously fails to — I'd genuinely like to hear about it: issues and feature requests welcome, or find me on nf-core Slack.